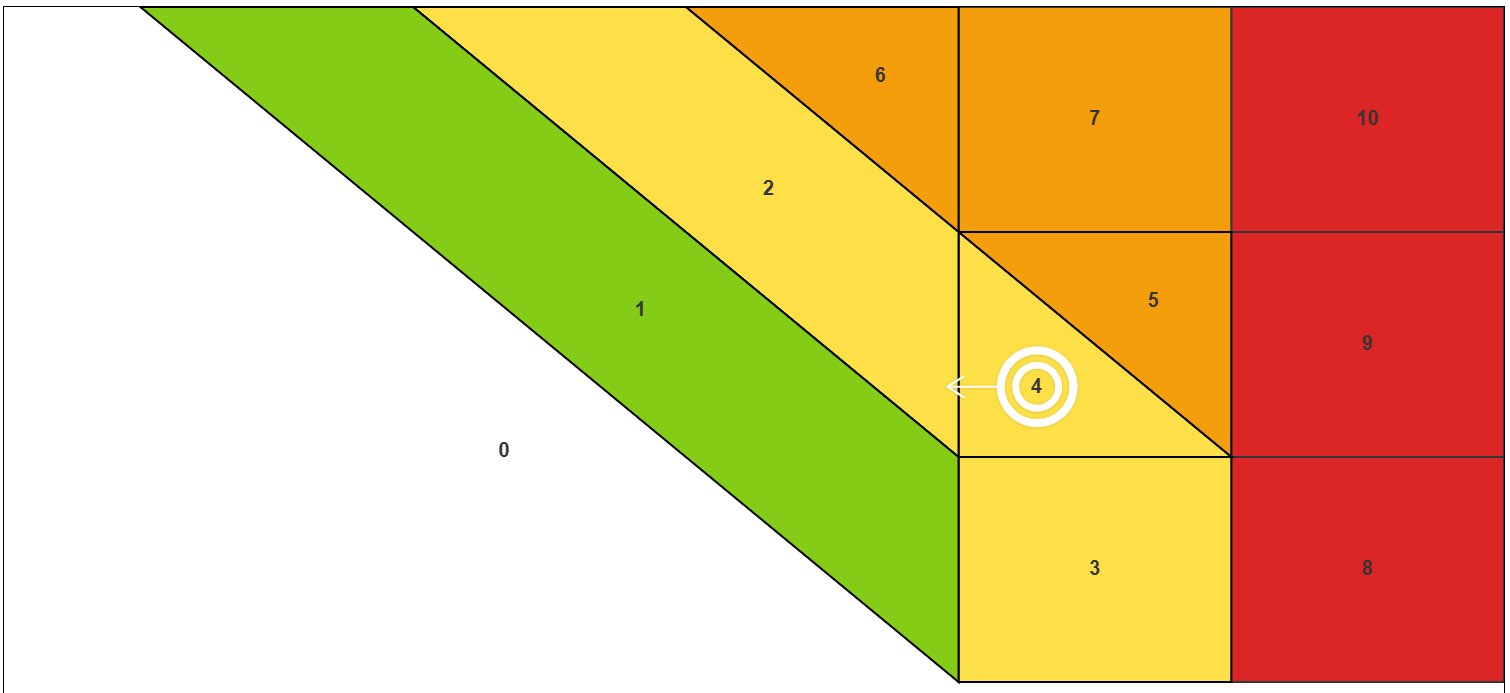
Organizations like NASA use the Torino Scale to evaluate the potential threat posed by near-Earth objects (NEOs), such as asteroids and comets.
At the April 2024 edition of BrightonSEO, I introduced the concept of using the Torino Scale as a framework for assessing and communicating the “potential impact hazard” of Google updates, emerging technologies, and legislative changes. This approach allows you to visually map any factors identified through a PESTLE analysis onto a scale.
The Torino scale has also served as the model for the Rio scale. The RIO scale is a means of quantifying the significance of a SETI (Search for extraterrestrial intelligence detection.
Adopting The Torino For SEO
Below are some real-world examples of Nasa utilizing the Torino Scale, and comparable examples in the SEO space.
| Nasa Event | SEO Event | Torino Score |
| The Chicxulub impact | Domain level penalty causing sitewide deindexing | 10 |
| 2018 LB1 | Changing the CSS colors of non-CTA elements on the website. | 1 |
| 99942 Apophis | Google moving URLs in a particular subfolder to “Discovered – currently not indexed” in GSC, correlating with performance loss. | 4 |
The important thing to note with the Torino Scale is that the initial numbers assigned are not static.
Torino scores can go up, or down, depending on information gained through further observations, data, and other external variables. The majority of Torino values Nasa assigns to NEOs start at one, and then decrease to zero.
Nasa also tends to be conservative with classifications as to not spark panic. With SEO I propose taking the opposite approach. Making stakeholders aware of a potential risk and then de-risking it can provide greater resource allocation and awareness to a problem, whereas saying something might not be a problem then escalating can cause friction.
An example of this would be the 99942 Apophis – in late 2004, this asteroid was given a rating of four, the highest rating ever given on the Torino scale. At the time, it had a 1.6% chance of hitting Earth. In the above table I’ve likened this to the mass-movement of URLs to “Discovered – currently not indexed” which could well indicate issues with crawl budget, website crawl and renderability, or issues with quality perception – all things that warrant immediate monitoring and further analysis.
Based on the SEO version of the Torino Scale, I’d upgrade this from a four to a nine.
SEO Torino Scale Classifications
For the SEO Torino scale to work, it needs a set of objective classifications. Much like Fibonacci scoring in agile development (or tshirt sizing if you prefer that method), the classification scale needs to be flushed with real-world examples relevant to your organization as scores are not always transferable across different businesses.
For instance, a high rating on this adapted scale could signal substantial potential changes to organic search performance, indicating the need for close monitoring and strategic adjustments.
Below are the classifications I use as the “baseline” and then adapt to different organization needs and understandings.
| Score | Classification |
| 1 | Potential risk, but not enough data or understanding at present to determine the scale or likelihood of the risk. |
| 2 | Upgrading from a score of 1, confidence growing that there is a risk either at subfolder-level, or (partial) domain level. |
| 3 | Higher probability of issues and risk a page level. |
| 4 | Growing confidence and higher probability of issues and risk either at a subfolder-level, or partial domain level. |
| 5 | Upgraded risk from four in probability and impact at subfolder-level, or partial domain-level. |
| 6 | Risk identified is substantial, potentially at a domain level. The likelihood of issues and risk is roughly 50/50. |
| 7 | Upgrading from a score of 6, increased confidence in the probability of a substantial domain-level impact. |
| 8 | Near certainty of a page-level impact. |
| 9 | Near certainty of a subfolder or partial domain-level impact. |
| 10 | Near certainty of a domain level, substantial impact. |
Understanding the score, helps you plot elements on the scale. For example, the below example has been initially plotted as a four, but with a chance of being downgraded:

As a dynamic visual aid, this tool can be updated between meetings to reflect changing risks.
During stakeholder discussions, you can provide context for why certain items have been upgraded or downgraded in terms of their potential impact on the business and organic search performance.